Climate Graphs
Almost all of Italy enjoys Mediterranean climate. This gives Italy hot summers, warm winters and longs hours of sunshine throughout the whole year. The people living there do not have to worry about the rain and flooding unless it is winter, but even then, the chances of flooding is very small.
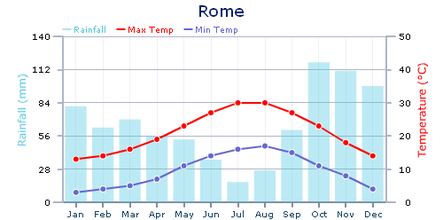
This is a climate graph for Rome.
Florence This is the climate graph for Florence. The amount of rainfall it receives is the lowest in July. This is the same as Rome. In July, it rains around about 30mm which is more than it rains in Rome. It rains the most in November, when the average rainfall is around 100mm. This is less than the highest amount of rainfall that Rome gets. The lowest temperature is in January, when it is about 6 degrees and the highest temperature is in July when it is 25 degrees. This means that Florence is colder than Rome in Winter and it is cooler than Rome in the summer as well. 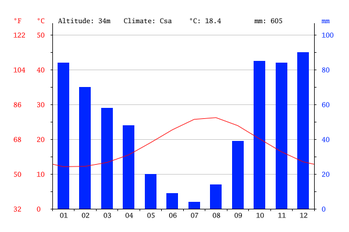
This is a climate graph for Palermo.
|
Rome
This is the climate graph for Rome. The amount of rainfall received is at its minimum point in July, at the peak of the summer months when the total rainfall is only 16mm. However, the highest amount of rainfall is in October when the amount of rainfall is over 112mm. Compared to the British weather in October, Rome receives more rainfall by around 50mm. In the summer, the lowest temperature is around 15 degrees (in January) and the highest temperature is 30 degrees (in July). However, in the winter, the minimum temperature is 5 degrees (in January), this can rise up to around 12 degrees (also in January). 
This is climate graph for Florence.
Palermo This is the climate graph for Palermo. Palermo receives the lowest amount of rainfall in July, again like Rome and Florence, it is at the peak of the summer months. The amount of rainfall it gets in July is 5mm. This is even less than Rome. The highest amount of rainfall is 90mm in December. This is also lower than Rome's highest rainfall. This means that Palermo is dryer than Rome. The lowest temperature is in February when it is just 12 degrees. the highest temperature is in August when it is 26 degrees. |
From all three climate graphs, we can see that the amount of rainfall and the temperatures in Winter and Summer are all very similar. This is because they are all places in Italy so we can find links and similarities between each area. From the graphs, the best time to visit Italy is in July, when there is the least amount of rainfall, but the highest temperature.
